




Written By: Dr. Gagandeep Singh, MBBS
Medically Reviewed By: Dr. Gagandeep Singh, MBBS
Last Updated: 23 October 2026
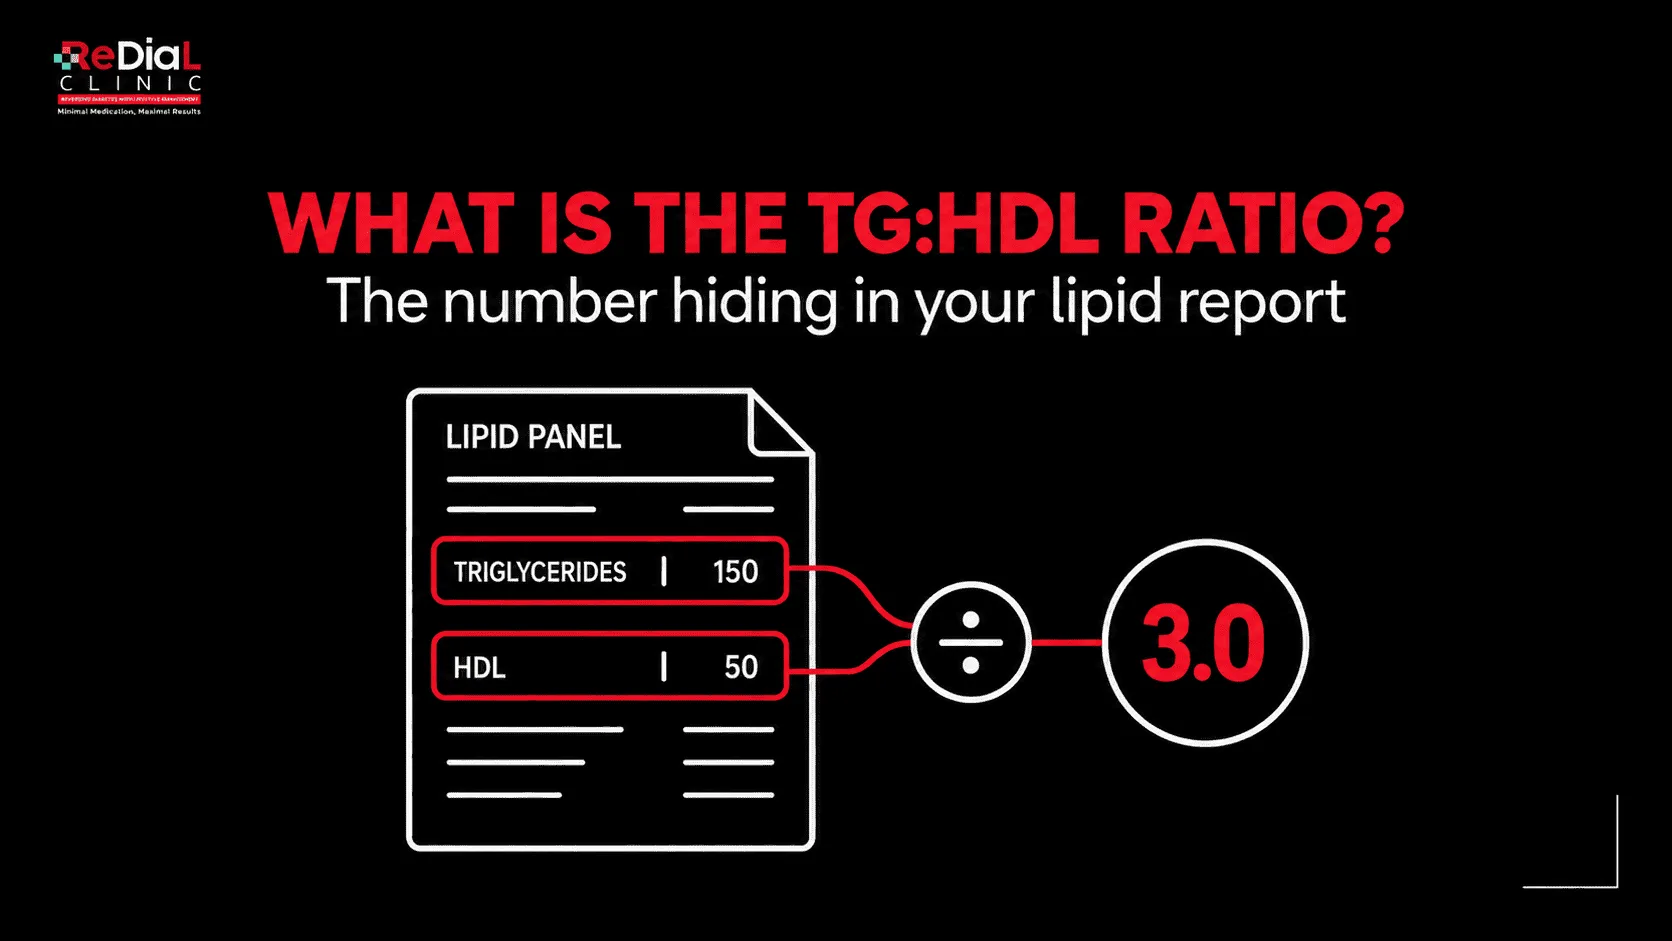
The TG:HDL ratio is calculated from two numbers you already have on a standard lipid panel.
| Key Takeaways The TG:HDL ratio is triglycerides divided by HDL cholesterol (both in mg/dL) — a free calculation hiding inside a lipid panel you may have already had done. A ratio below 2 is generally considered optimal; 2–3 is a moderate/watch-zone; a ratio above 3 has been linked to insulin resistance in research using gold-standard clamp testing. A high TG:HDL ratio can appear years before fasting glucose or HbA1c move out of the normal range, because it reflects insulin resistance upstream of blood sugar changes. It is a surrogate marker, not a stand-alone diagnostic test — it supports a clinical picture, it does not replace one. Two levers reliably improve it in most people: reducing refined-carbohydrate/sugar load and building muscle through resistance training, which increases glucose disposal. |
If you have ever had a routine lipid panel done — for an annual health check, an insurance medical, or before starting a gym programme — you already have the two numbers needed to calculate one of the most underused early-warning markers in metabolic medicine: the TG:HDL ratio. Most patients never hear this number mentioned. Most doctors do not calculate it routinely. And yet in our clinic in Green Park, New Delhi, it is often the first clue that insulin resistance is already at work, well before fasting glucose or HbA1c cross any threshold.
What is the TG:HDL ratio?
The TG:HDL ratio is the value you get when you divide your triglyceride level by your HDL (“good”) cholesterol level, using the same units (mg/dL) for both. It is not a separate blood test — it is a simple calculation performed on numbers that are already part of a standard lipid profile. A lower ratio generally reflects a healthier balance between fat-carrying triglycerides and protective HDL particles; a higher ratio has been associated with insulin resistance and a more atherogenic lipid pattern.
Both triglycerides and HDL are influenced by how efficiently your body handles glucose and fat. When insulin resistance is present, the liver tends to push out more triglyceride-rich particles (VLDL) while HDL levels tend to fall — which is exactly why the ratio between the two moves in a predictable direction as insulin resistance develops. This is discussed further under “How does the TG:HDL ratio show insulin resistance?” below.
For general background on the underlying condition this marker reflects, see our guide What Is Insulin Resistance?.
How do I calculate my TG:HDL ratio?
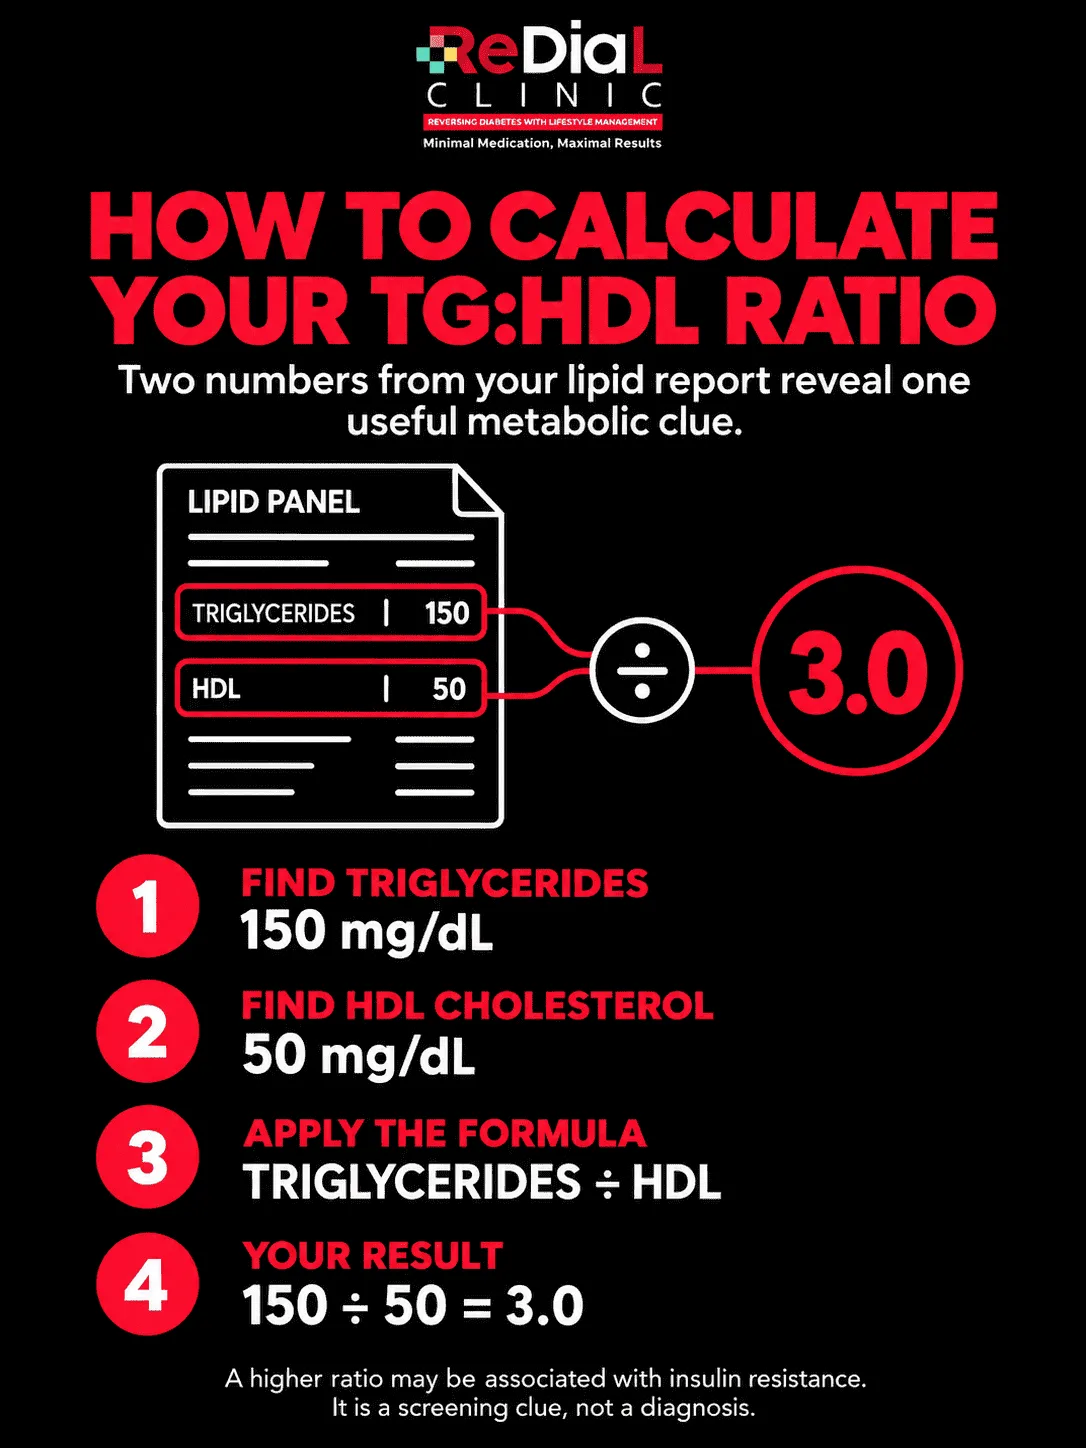
To calculate your TG:HDL ratio, take the triglyceride value from your lipid panel (in mg/dL) and divide it by the HDL cholesterol value (in mg/dL) from the same report. Both numbers are printed on virtually every standard lipid profile done in India, so no additional test is required — you can calculate this at home in under a minute.
Formula, worked example, and the commonly cited range bands for the TG:HDL ratio.
Worked example: if your triglycerides are 150 mg/dL and your HDL is 50 mg/dL, the calculation is 150 ÷ 50 = 3.0. A second example: triglycerides of 90 mg/dL with HDL of 60 mg/dL gives 90 ÷ 60 = 1.5, which sits in the optimal range described below. The formula stays the same regardless of your absolute numbers — what matters clinically is the ratio between the two, not either value viewed in isolation.
A quick note on units: Indian labs almost always report both triglycerides and HDL in mg/dL, so most Indian patients can use this formula directly. If a report uses SI units (mmol/L), the ratio calculation still works the same way as long as both values use the same unit system — but the reference cut-offs discussed below were derived using mg/dL and do not translate directly if you mix units.
What is a normal TG:HDL ratio?
A TG:HDL ratio below 2 is commonly considered optimal, a ratio between 2 and 3 is viewed as a moderate or “watch” zone, and a ratio above 3 has been linked to insulin resistance in research using the hyperinsulinemic-euglycemic clamp — the gold-standard method for measuring how resistant the body’s cells are to insulin. These are commonly cited research bands, not a diagnostic cut-off carved in stone for every individual.
| Zone | TG:HDL Ratio (mg/dL units) | What it suggests |
| Optimal | Below 2.0 | Lower likelihood of significant insulin resistance based on lipid pattern |
| Moderate / watch zone | 2.0 – 3.0 | Worth discussing with your doctor alongside other markers (waist circumference, fasting insulin, family history) |
| High | Above 3.0 | Associated with insulin resistance in clamp-validated research; warrants a fuller metabolic work-up |
TG:HDL reference zones: below 2.0 optimal, 2.0–3.0 watch zone, above 3.0 associated with insulin resistance in research.
The above bands are informed by the original clamp-validation research (see “How does the TG:HDL ratio show insulin resistance?” below), which identified an optimal cut-point of 3.0 (in mg/dL units) for distinguishing insulin-resistant from insulin-sensitive overweight adults. Research in South Asian populations specifically has found the useful range for flagging insulin resistance sits lower — broadly in the 2.0–3.8 mg/dL band depending on the study — which is one reason we do not treat a single universal number as gospel for every patient in our Indian clinical practice.
This variation by ethnicity matters. South Asians tend to develop insulin resistance and cardiometabolic risk at lower body-fat and lipid thresholds than white European populations — the same pattern seen with BMI and waist-circumference cut-offs used by ICMR. We interpret the TG:HDL ratio in that context rather than applying a Western cut-off blindly.
How does the TG:HDL ratio show insulin resistance?
The TG:HDL ratio rises with insulin resistance because insulin resistance directly changes how the liver packages and releases fat. When cells stop responding normally to insulin, the liver increases output of triglyceride-rich VLDL particles, and HDL cholesterol tends to fall as a downstream consequence of this altered lipid traffic — so the ratio between the two climbs before fasting glucose typically moves.
The chain of events linking insulin resistance to a rising TG:HDL ratio — upstream of the markers most panels flag first.
This is the same upstream mechanism we discuss throughout our clinical approach: insulin resistance is the engine, and markers like HbA1c, fasting glucose, blood pressure, and lipid readings are the dashboard lights that come on later. Elevated insulin levels increase hepatic (liver) triglyceride synthesis and secretion as VLDL, while simultaneously altering the enzymes that regulate HDL particle metabolism — a relationship well described in reviews of the pathophysiology linking insulin resistance to cardiometabolic risk factors, including dyslipidaemia and elevated blood pressure.
The clamp-based validation work that established the TG:HDL ratio as a practical proxy for insulin resistance was done by McLaughlin and colleagues at Stanford, who tested 258 non-diabetic overweight adults against the insulin suppression test (a clamp-based reference method) and found the triglyceride-to-HDL ratio performed comparably to fasting insulin itself at identifying insulin-resistant individuals. This is why the ratio is used as a low-cost, no-extra-test proxy in both research and everyday clinical screening — it correlates with a much more expensive, much less practical gold-standard test.
For more on how insulin resistance connects to blood pressure specifically, see The Link Between Hypertension and Diabetes, and for how to check for insulin resistance more broadly, see How to Check for Insulin Resistance.
| From the clinicIn our clinic, we regularly see patients in their early-to-mid thirties whose fasting glucose and HbA1c both sit comfortably inside the “normal” range on paper, yet their TG:HDL ratio is already above 3 — often the only number on the report that hints at what is coming. In several of these cases, a closer look at fasting insulin and waist circumference confirmed early insulin resistance that a glucose-only reading would have missed entirely for another several years. |
Is the TG:HDL ratio a diagnostic test?
No — the TG:HDL ratio is a surrogate marker, not a stand-alone diagnostic test. It is a useful, low-cost screening clue that correlates with insulin resistance in research populations, but it should never be used by itself to diagnose insulin resistance, prediabetes, diabetes, or any other condition. A doctor interprets it alongside your fasting glucose, HbA1c, fasting insulin (if available), waist circumference, blood pressure, and personal and family history.
This distinction matters for a few practical reasons. First, the ratio’s accuracy varies by ethnicity, sex, and body composition — the cut-points that work well in one population studied are not automatically identical for another. Second, triglycerides can be temporarily elevated by a recent meal, alcohol, certain medications, or an unfasted sample, which will distort the ratio without reflecting your true metabolic baseline — always calculate it from a fasting lipid panel. Third, a single favourable ratio does not rule out insulin resistance detected by other means, and a single elevated ratio does not automatically mean disease is present. It is one data point that earns a closer look, not a verdict.
Can the TG:HDL ratio be improved?
Yes — the TG:HDL ratio can improve in most people because it reflects insulin resistance, and insulin resistance responds to the same two levers that drive most metabolic improvement: reducing the glucose/insulin load coming in through diet, and increasing glucose disposal through resistance training and general activity. Improvement in the ratio is usually a sign that both triglycerides are falling and HDL is recovering not just one moving in isolation.
Lever 1: Reduce the glucose and refined-carbohydrate load
Triglyceride production by the liver is heavily influenced by excess refined carbohydrate and sugar intake, which the liver converts and packages as VLDL when it exceeds what is needed. Shifting the plate towards whole foods, adequate protein, fibre, and away from refined flour, sugar, and ultra-processed snacks — the roti/rice portion and the frequency of chai-with-biscuits through the day are common levers we adjust first in Indian dietary patterns — tends to lower triglycerides meaningfully within weeks.
Lever 2: Increase glucose demand through resistance training
Skeletal muscle is the body’s largest site of glucose disposal, and building or activating more of it through resistance training increases how much glucose your muscles can clear from the bloodstream without needing as much insulin. Over time, this reduces the insulin resistance driving the liver’s excess triglyceride output, which is reflected in a falling TG:HDL ratio alongside other markers.
For more detail on structuring this, see our guides on Weight Loss for Insulin Resistance and How to Reverse Insulin Resistance Naturally.
A medication safety note: if you are already on medication for diabetes (including insulin or sulfonylureas), blood pressure, or cholesterol, do not stop or reduce any medication because your TG:HDL ratio has improved. Dietary and training changes can lower insulin requirements and blood pressure fairly quickly, and continuing unchanged doses in that situation can cause hypoglycaemia or low blood pressure. Any deprescription — reducing or stopping a medication — must be a supervised decision made by your treating physician based on your full picture, not a self-directed step.
| From the clinicA patient in his late twenties came to us after a routine corporate health check flagged a TG:HDL ratio of roughly 4, despite normal fasting glucose. Over a structured programme addressing refined-carbohydrate intake and adding twice-weekly resistance training, his triglycerides fell and HDL improved over a few months, bringing the ratio down into the moderate zone — alongside improvements in waist circumference and energy levels. His case is a reminder that this marker can move well before glucose numbers would have prompted any conversation at all. |
We have also seen the reverse pattern: a patient with an already-diagnosed PCOS history whose TG:HDL ratio stayed persistently above 3 despite a seemingly reasonable diet, which on closer questioning turned out to be driven by frequent late-evening sugary chai and poor sleep. Addressing sleep and evening eating patterns alongside the standard two-lever approach brought her ratio down meaningfully within a couple of months — a useful reminder that the drivers behind a high ratio are not always obvious on the first conversation.
Next Step
| Not sure what your lipid report is really telling you? Book a metabolic lab review at Redial Clinic. Our team will walk through your TG:HDL ratio alongside your full metabolic picture — fasting insulin, waist circumference, blood pressure, and history — and help you understand what, if anything, needs to change. Visit us at our Green Park, New Delhi clinic or book a consultation online.
Book a Metabolic Assessment at Redial Clinic, Green Park, New Delhi. |
Frequently Asked Questions
What is a healthy TG to HDL ratio?
A TG:HDL ratio below 2 (using mg/dL values) is generally considered the optimal or healthy range in most research. A ratio between 2 and 3 is a moderate zone worth monitoring, and a ratio above 3 has been associated with insulin resistance in clamp-validated studies. These bands are commonly cited reference ranges, not a fixed diagnostic threshold for every individual — your doctor will interpret your number alongside your fuller metabolic picture.
How does TG to HDL ratio show insulin resistance?
Insulin resistance causes the liver to release more triglyceride-carrying VLDL particles while HDL cholesterol tends to fall as a downstream effect — so the ratio between the two rises as insulin resistance develops, often before fasting glucose or HbA1c change. This is why the TG:HDL ratio is used as a low-cost surrogate marker for insulin resistance in both research and clinical screening.
How do I calculate my TG to HDL ratio?
Divide your fasting triglyceride value (mg/dL) by your fasting HDL cholesterol value (mg/dL) from the same lipid panel — for example, triglycerides of 150 mg/dL divided by HDL of 50 mg/dL gives a ratio of 3.0. Both numbers are already printed on a standard lipid profile, so no additional blood test is needed; just make sure the sample was drawn fasting for an accurate result.
Can the TG to HDL ratio be improved?
Yes, in most people the TG:HDL ratio improves with the same two levers that improve insulin resistance generally: reducing refined-carbohydrate and sugar intake to lower triglyceride production, and building muscle through resistance training to increase glucose disposal and reduce the insulin resistance driving the liver’s excess triglyceride output. If you are on medication for diabetes, blood pressure, or cholesterol, any dose changes should be supervised by your doctor, not self-directed.
Medical Disclaimer
This article is for educational purposes only and does not constitute medical advice, diagnosis, or treatment. The TG:HDL ratio is a surrogate marker, not a diagnostic test, and individual results should always be interpreted by a qualified physician in the context of your complete medical history. Never start, stop, or change any medication — including insulin, oral diabetes medication, or blood pressure medication — without direct supervision from your treating doctor. If you have concerns about your lipid panel or metabolic health, please consult Dr. Gagandeep Singh or another qualified healthcare provider at Redial Clinic, Green Park, New Delhi.
References
- McLaughlin T, Abbasi F, Cheal K, Chu J, Lamendola C, Reaven G, “Use of Metabolic Markers to Identify Overweight Individuals Who Are Insulin Resistant,” Annals of Internal Medicine, 2003.
- Mostafa SA, Davies MJ, Webb DR, Srinivasan BT, Gray LJ, Khunti K, “The Association of the Triglyceride-to-HDL Cholesterol Ratio with Insulin Resistance in White European and South Asian Men and Women,” PLOS ONE, 2012.
- DeFronzo RA, Tripathy D, “Skeletal Muscle Insulin Resistance Is the Primary Defect in Type 2 Diabetes,” Diabetes Care, 2009.
- Anjana RM et al. (ICMR-INDIAB-17), “Metabolic Non-Communicable Disease Health Report of India,” The Lancet Diabetes & Endocrinology, 2023.
- Ludwig DS, Ebbeling CB, “The Carbohydrate-Insulin Model of Obesity,” JAMA Internal Medicine, 2018.

 Facebook
 Instagram
 LinkedIn