Written By: Dr. Gagandeep Singh
Medically Reviewed By: Dr. Gagandeep Singh, MBBS
Last Updated: 24 March 2026
If your lab report says ‘normal’ but your waistline, fatigue, or post-meal crashes tell a different story, there is a good chance you are measuring the wrong things. Fasting blood sugar — the test most people rely on — is one of the last markers to become abnormal in the insulin resistance timeline. By the time it rises, the metabolic problem may have been building quietly for years.
Understanding how to check for insulin resistance properly can change your health trajectory. The right combination of tests reveals what standard screenings often miss — and the earlier you catch it, the more options you have to improve it.
This guide explains which tests actually detect insulin resistance, what they measure, and what they miss — so you can have a more informed conversation with your doctor the next time you review your reports.
Key Takeaways
- Fasting blood sugar alone can remain normal for years while insulin resistance develops silently in the background.
- Fasting insulin and HOMA-IR are among the most useful early markers, yet most routine blood panels do not include them.
- HbA1c, post-meal glucose, waist circumference, triglycerides, and HDL cholesterol each provide a different piece of the metabolic picture.
- Indian adults face higher metabolic risk at lower BMI and waist measurements compared to Western populations — screening thresholds should reflect this.
- Continuous glucose monitoring (CGM) can uncover post-meal glucose spikes that fasting tests miss entirely.
- No single test confirms insulin resistance on its own — a metabolic workup combining several markers gives the clearest picture.
Why Fasting Blood Sugar Alone Is Not Enough
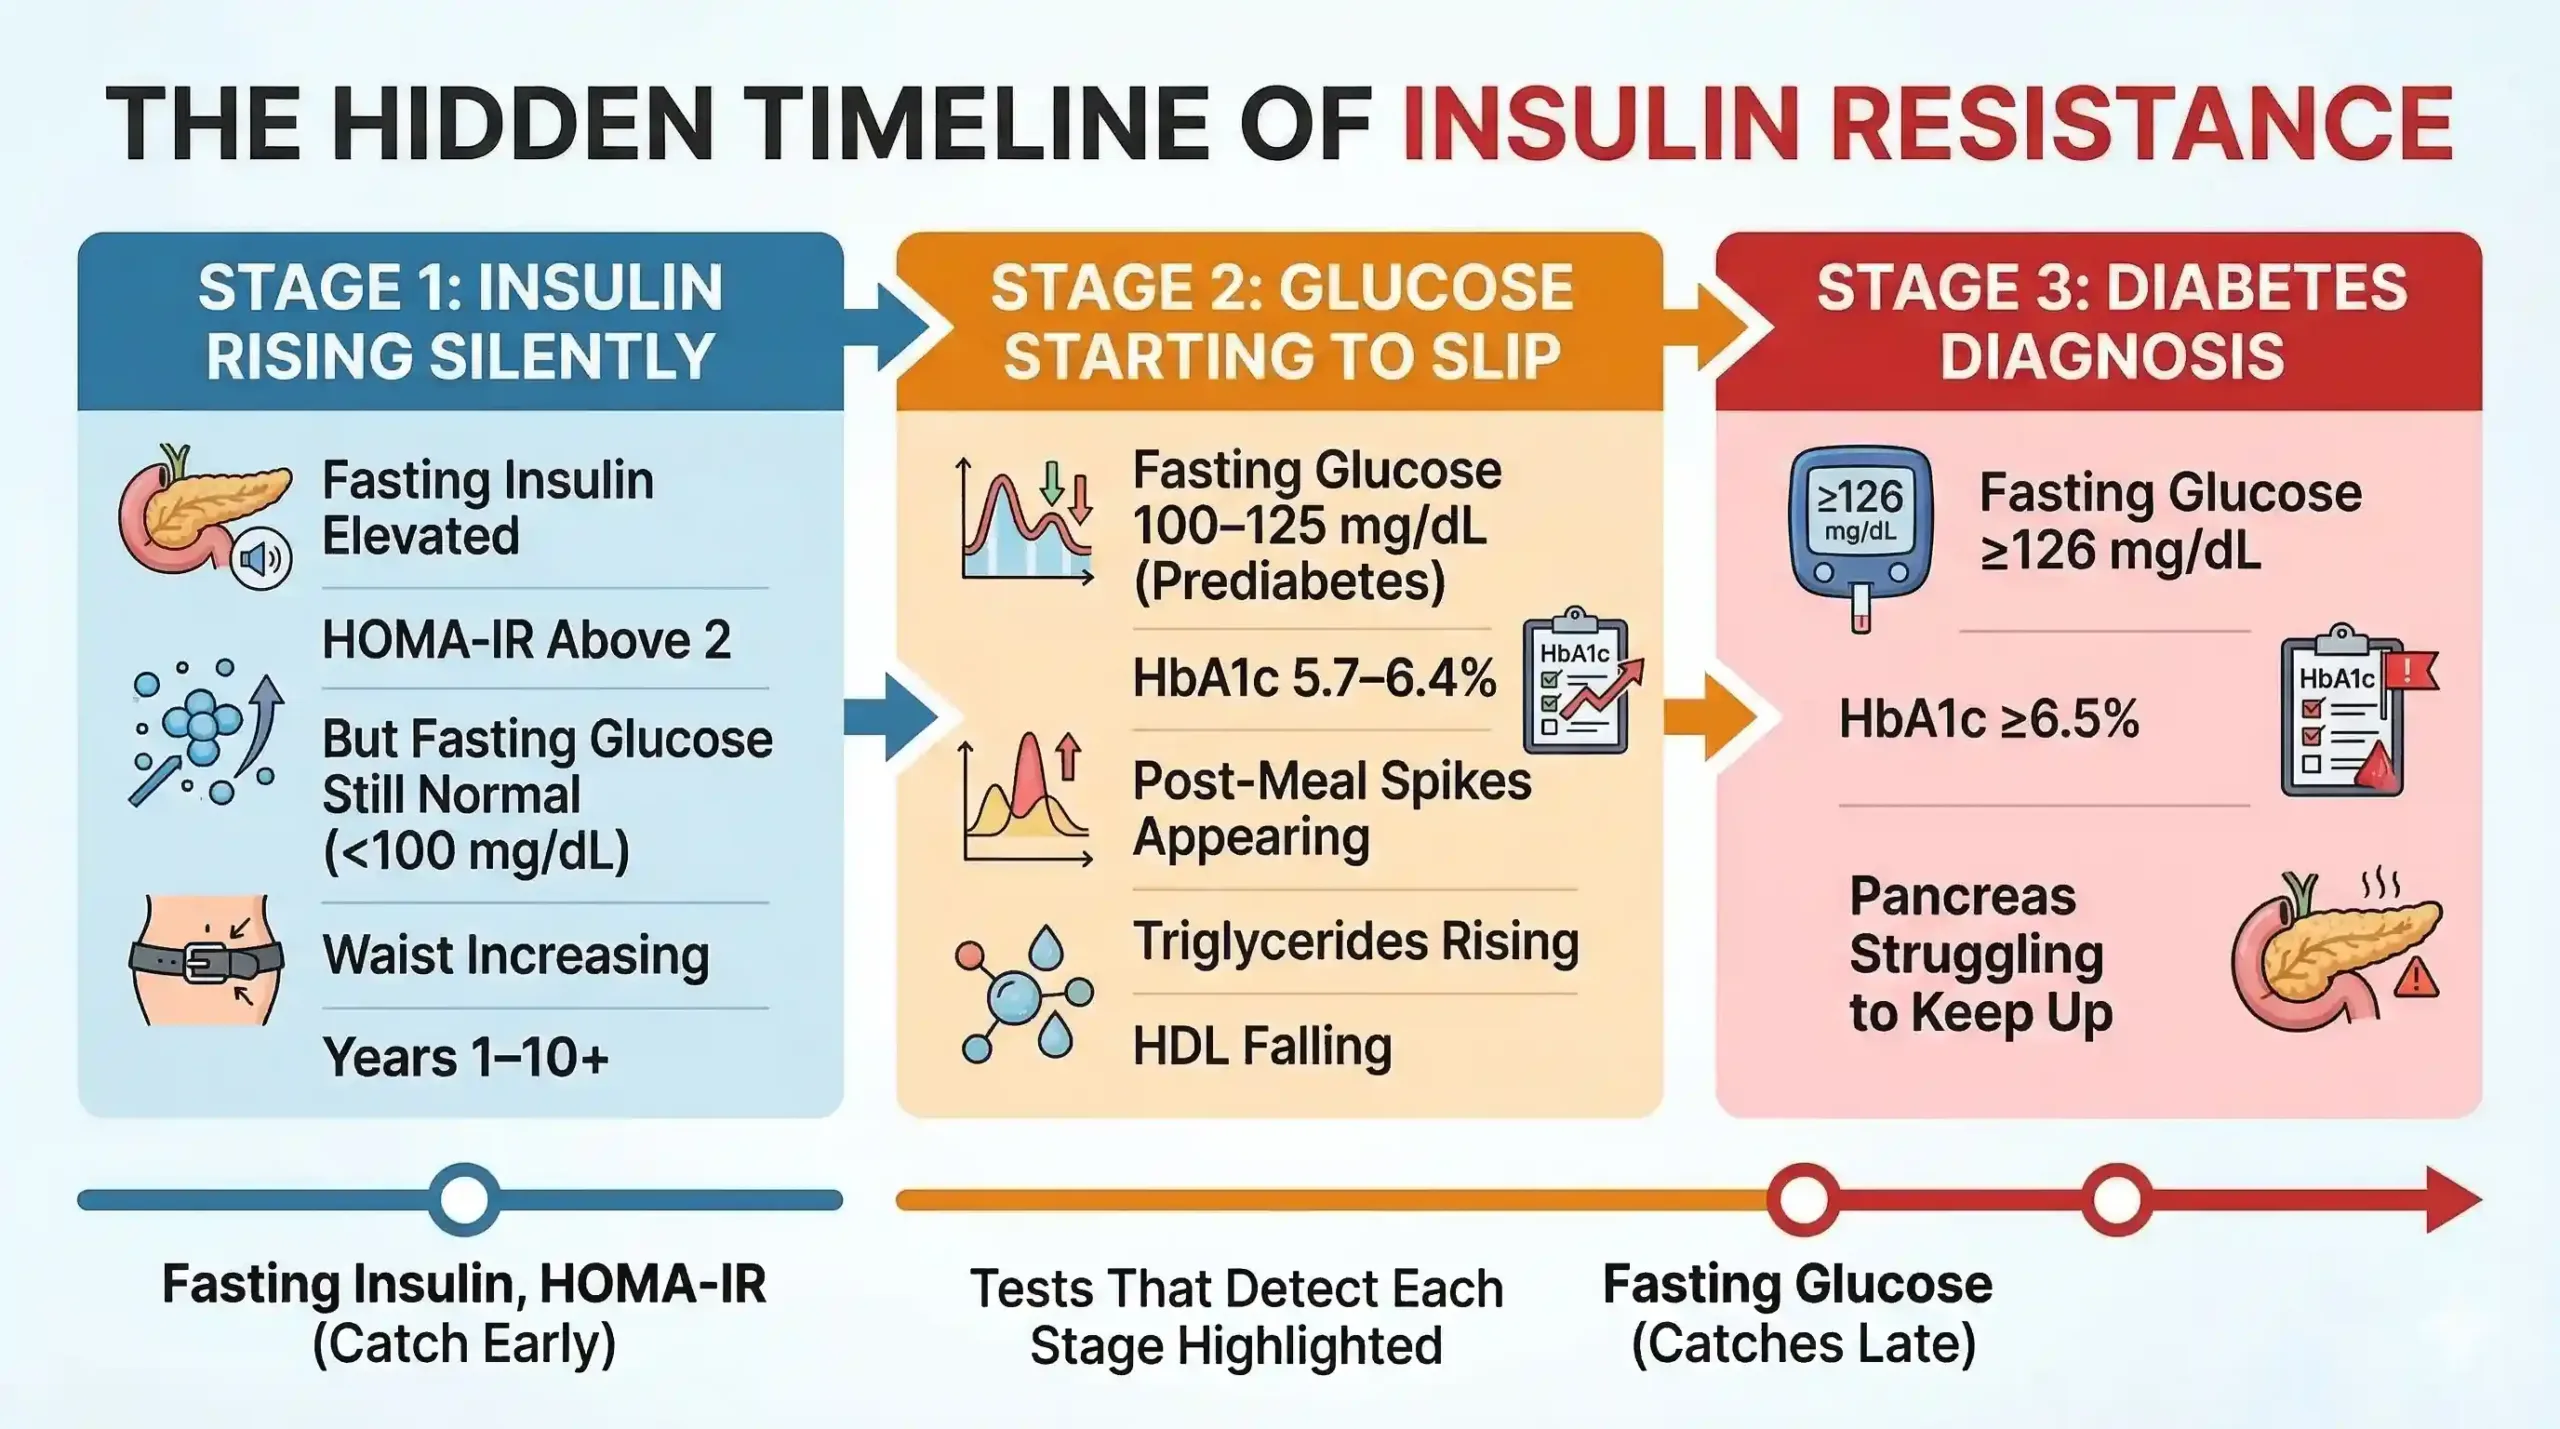
Fasting blood sugar (fasting plasma glucose or FPG) measures how much glucose is in your blood after an overnight fast — but it only captures one narrow moment in a complex metabolic process. Insulin resistance often develops years before fasting glucose rises above the normal cutoff of 100 mg/dL, making it an unreliable early warning system on its own.
Here is why this matters: when your cells start responding less efficiently to insulin, your pancreas compensates by producing more insulin to keep blood sugar in check. For a long time, this compensation works. Your fasting glucose stays in the ‘normal’ range — not because your metabolism is healthy, but because your pancreas is working overtime to maintain the appearance of normality.
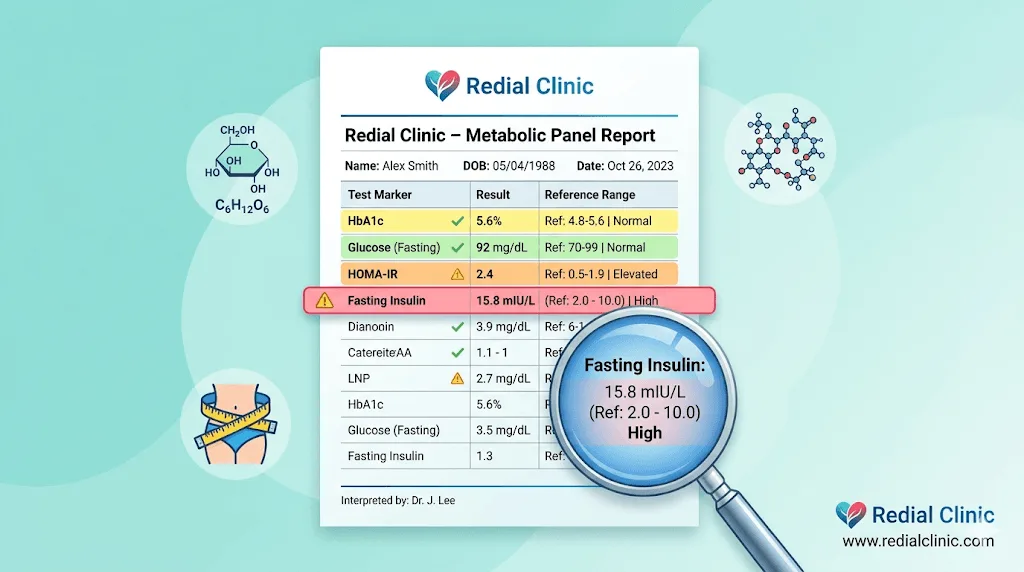
In our clinic, we regularly see patients whose fasting sugar sits comfortably at 90–95 mg/dL while their fasting insulin tells a completely different story. Their insulin is elevated, their waist is expanding, and their triglycerides are creeping up — but because the fasting glucose ‘looks fine’, nobody investigates further.
Research confirms this pattern. A landmark study by Tabák et al. showed that insulin resistance and beta-cell dysfunction progress for 10–12 years before fasting glucose crosses the diagnostic threshold for type 2 diabetes. Relying on fasting sugar alone means you are watching the scoreboard only in the final minutes of the match — and missing everything that happened before.
Fasting Insulin: What It Tells You That Glucose Cannot
A fasting insulin test measures how much insulin your pancreas releases to maintain normal blood sugar after an overnight fast. In a metabolically healthy person, fasting insulin is low — typically between 2 and 12 µIU/mL — because the body needs only a small amount of insulin to manage glucose efficiently. When fasting insulin is elevated, it signals that your cells are resisting insulin’s action and your pancreas is compensating by producing more.
This is what makes fasting insulin one of the earliest detectable markers of insulin resistance. It rises long before fasting glucose does. Think of it this way: fasting glucose tells you what happened; fasting insulin tells you how hard your body is working to make it happen.
At Redial Clinic in Green Park, New Delhi, fasting insulin is one of the first tests we include in a metabolic workup. Most standard health check-up packages in India do not include it — you typically need to request it specifically. The test requires an 8–12 hour overnight fast, just like a fasting glucose test, and is widely available at major diagnostic labs.
A rough clinical guide for interpretation:
- Below 5 µIU/mL: Excellent insulin sensitivity
- 5–12 µIU/mL: Generally considered normal
- 12–20 µIU/mL: Early insulin resistance territory — warrants attention
- Above 20 µIU/mL: Significant insulin resistance — further evaluation and intervention recommended
Note that reference ranges can vary between laboratories and populations. These are general guidelines — your doctor should interpret your result in the context of your full clinical picture.
HOMA-IR: How Doctors Quantify Insulin Resistance
HOMA-IR (Homeostatic Model Assessment of Insulin Resistance) is a calculated index that combines fasting insulin and fasting glucose into a single score, giving a more precise estimate of insulin resistance than either value alone. The formula is straightforward: fasting insulin (µIU/mL) × fasting glucose (mg/dL) ÷ 405. A higher score indicates greater insulin resistance.
Developed by Matthews et al. in 1985, HOMA-IR has become one of the most widely used tools in metabolic research and clinical practice because it requires only two simple fasting blood tests — no glucose challenge, no repeated blood draws.
General interpretation:
- Below 1.0: Optimal insulin sensitivity
- 1.0–1.9: Generally normal range
- 2.0–2.9: Early insulin resistance
- Above 2.9: Significant insulin resistance
It is worth noting that population-specific cutoffs can differ. Some Indian studies suggest that thresholds for South Asian populations may need to be lower, given the higher baseline metabolic risk in this group. The HOMA-IR test is not part of routine health screenings at most Indian labs, but any lab that offers fasting insulin and fasting glucose can provide the values you need to calculate it.
We find HOMA-IR especially useful for tracking progress. When a patient begins a diabetes reversal programme involving dietary changes, exercise, and sometimes medication adjustments, a falling HOMA-IR over three to six months provides objective evidence that insulin resistance is improving — even before HbA1c shows a significant shift.
HbA1c, Fasting Glucose, and Post-Meal Glucose
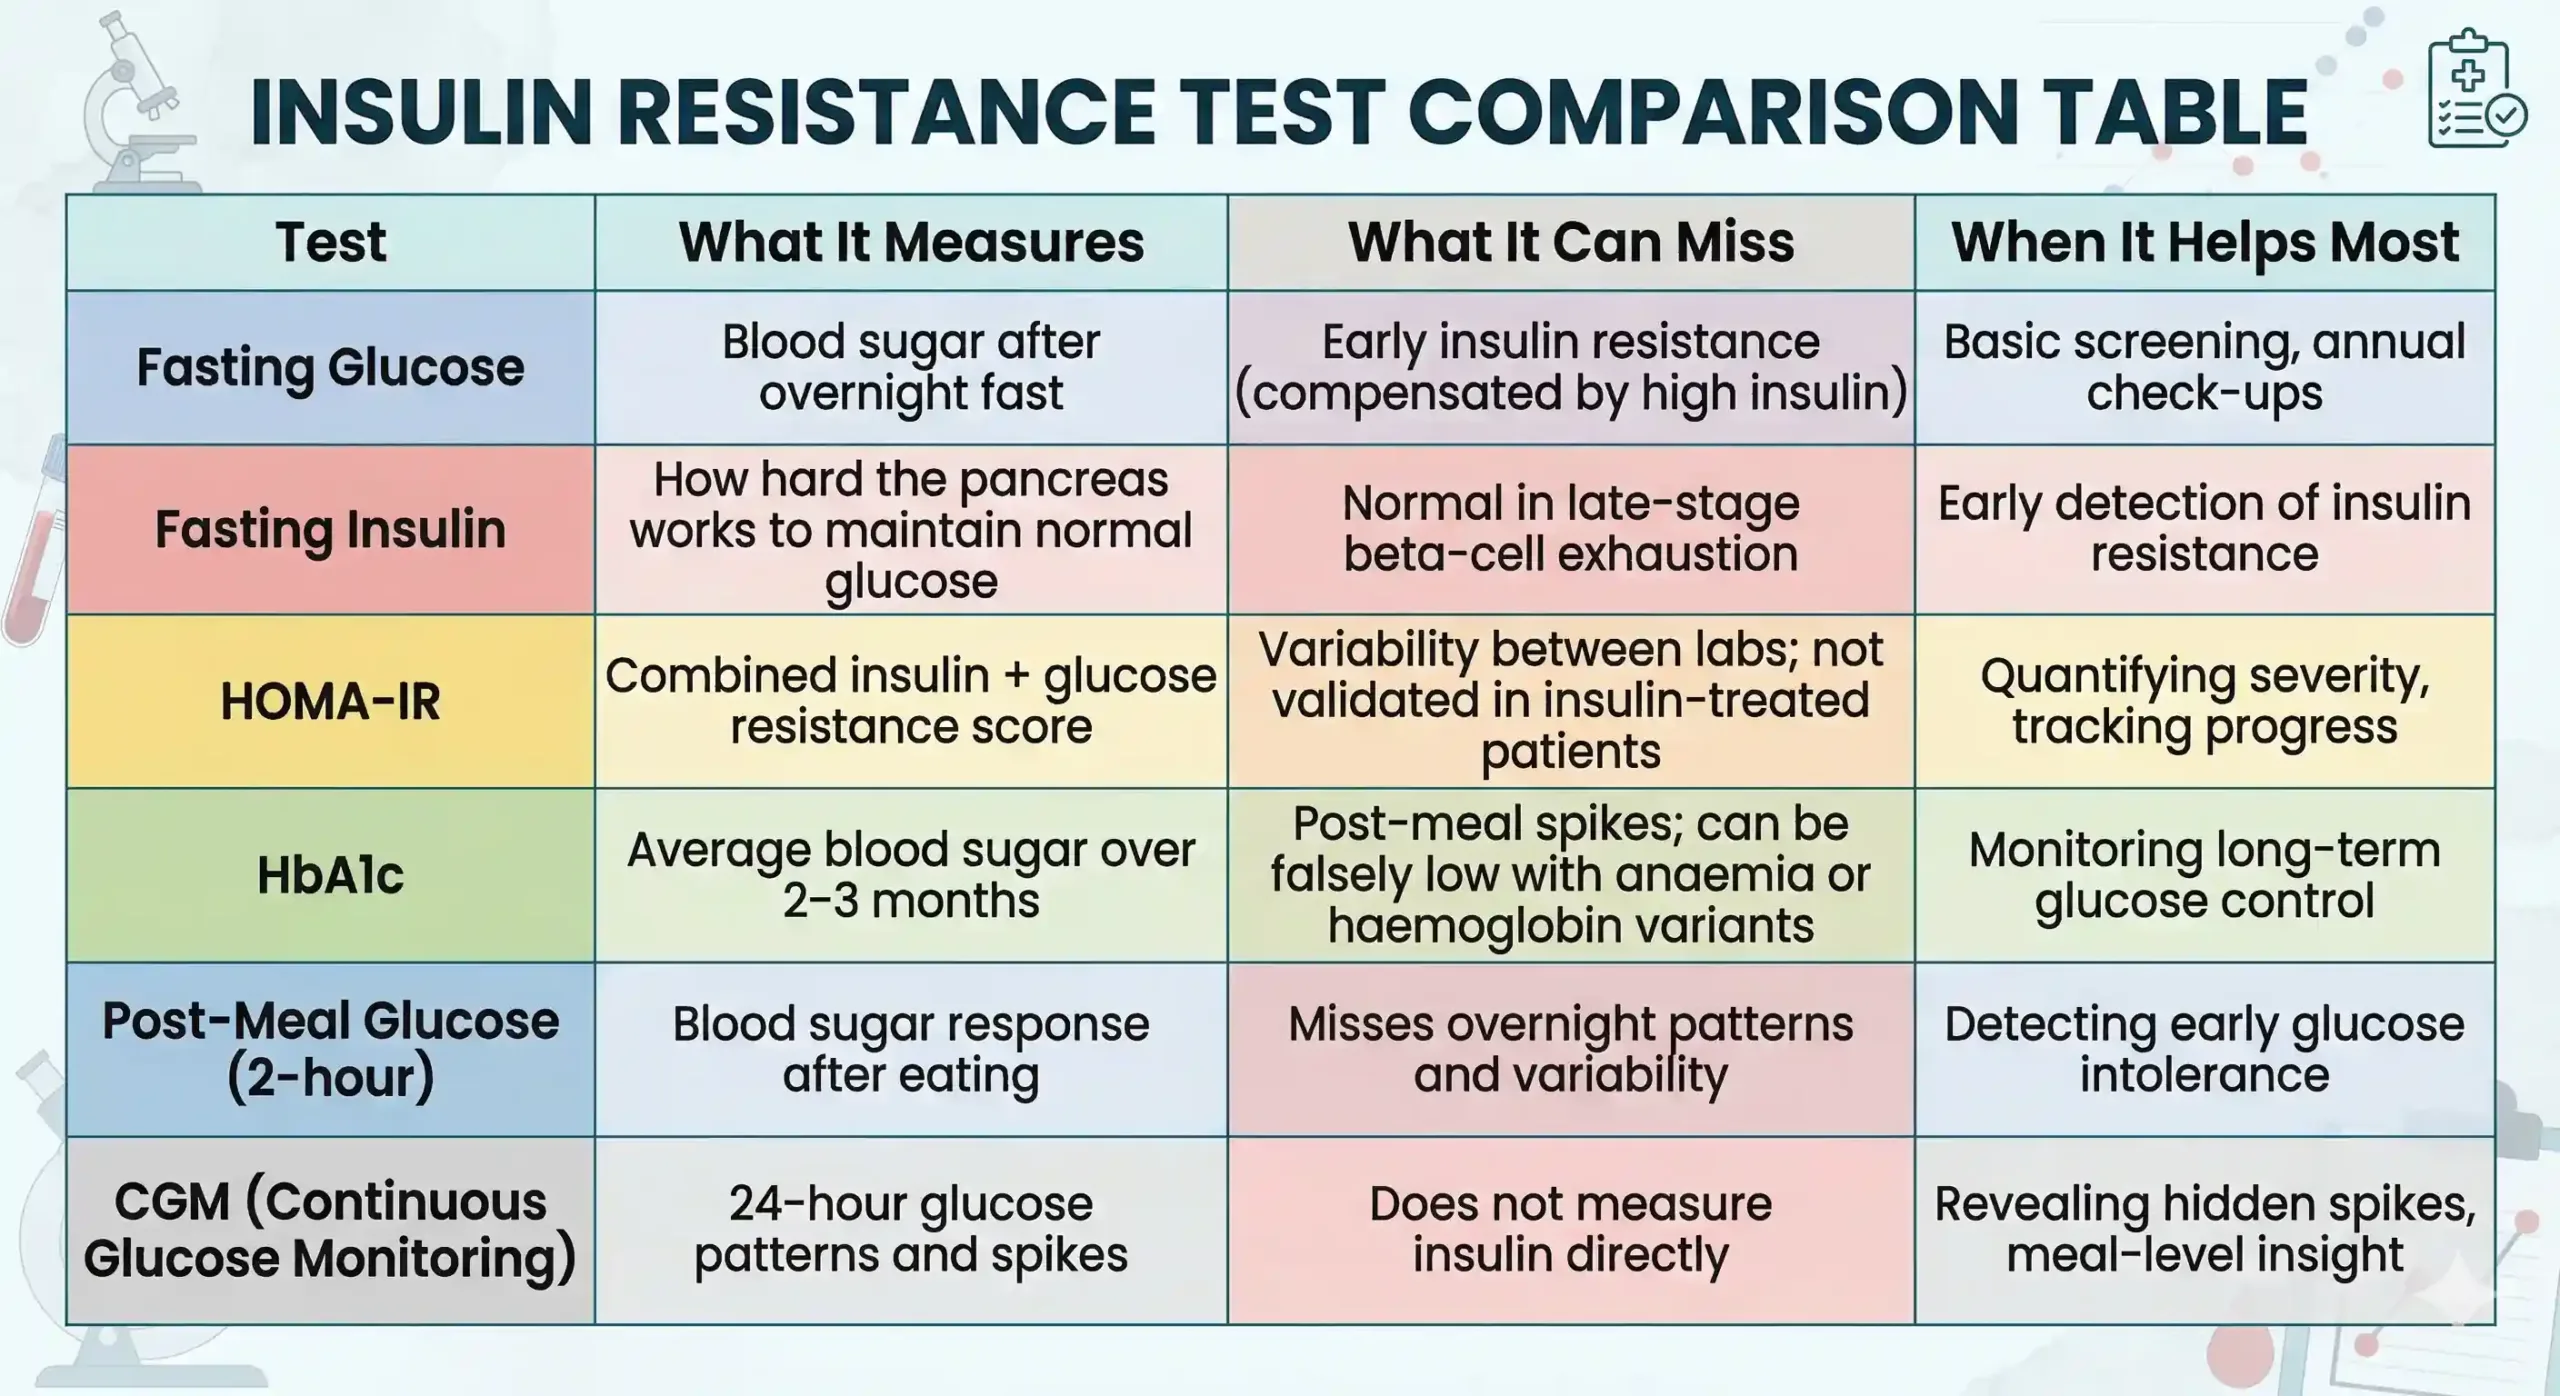
These three glucose-based tests form the backbone of diabetes screening, but each captures a different slice of your metabolic picture — and none of them directly measures insulin resistance. Understanding what each one does (and does not) reveal helps you interpret your lab reports with more clarity.
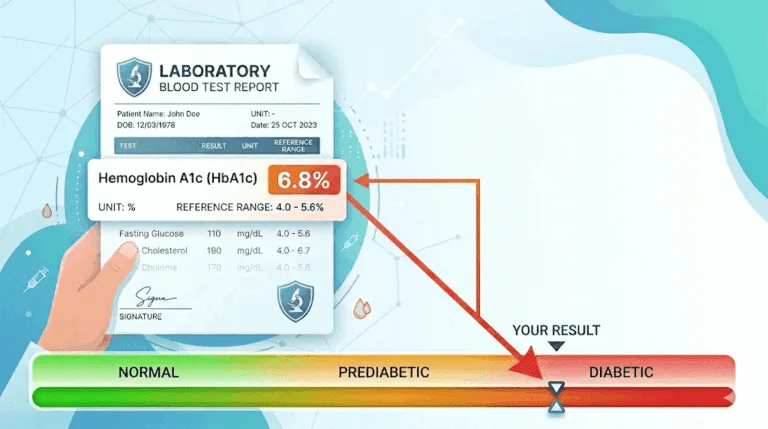
HbA1c (glycated haemoglobin) reflects your average blood sugar over the previous two to three months. The ADA classifies an HbA1c below 5.7% as normal, 5.7–6.4% as prediabetic, and 6.5% or above as diabetic. It is a useful trend marker, but HbA1c can be misleading in patients with iron-deficiency anaemia, haemoglobin variants (common in parts of India), or conditions that alter red blood cell turnover. We frequently see patients whose HbA1c sits at 5.8–5.9% — technically ‘borderline normal’ — while their fasting insulin and HOMA-IR clearly indicate insulin resistance is already established.
Fasting plasma glucose (FPG) is the most commonly ordered glucose test and the one most Indians are familiar with from routine check-ups. Normal is below 100 mg/dL; 100–125 mg/dL falls in the prediabetic (impaired fasting glucose) zone; 126 mg/dL or above on two occasions suggests diabetes. As discussed earlier, its main limitation is that it stays normal until the pancreas can no longer compensate — a relatively late event in the insulin resistance timeline.
Post-meal glucose (postprandial blood sugar) is measured two hours after eating and reveals how your body handles a carbohydrate load. A normal 2-hour post-meal reading is below 140 mg/dL. This test is especially relevant in the Indian dietary context, where meals centred around rice, roti, and dal can produce significant glucose spikes even when fasting numbers look fine. If your doctor has only been checking fasting sugar, asking for a post-meal reading can reveal problems that fasting tests miss entirely.
Waist Circumference, Triglycerides, HDL, and Blood Pressure
Not all insulin resistance markers require a blood test — your waist circumference, lipid profile, and blood pressure offer strong indirect clues, and together they can identify metabolic risk even before a formal insulin test is ordered.
Waist circumference is one of the most underrated and underused screening tools for insulin resistance. Visceral fat — the metabolically active fat stored around organs in the abdomen — is closely linked to insulin resistance, inflammation, and cardiovascular risk. For South Asian populations, the risk thresholds are lower than those used in Western guidelines:
- Men: ≥90 cm indicates elevated metabolic risk (compared to ≥94 cm in European guidelines)
- Women: ≥80 cm indicates elevated metabolic risk (same as European guidelines)
These modified cutoffs, recommended by the International Diabetes Federation for South Asian populations, reflect the higher susceptibility to metabolic disease at lower body measurements seen in Indian, Pakistani, Bangladeshi, and Sri Lankan populations.
Triglycerides and HDL cholesterol form what clinicians sometimes call the ‘insulin resistance lipid signature’. Elevated triglycerides (above 150 mg/dL) paired with low HDL cholesterol (below 40 mg/dL in men, below 50 mg/dL in women) is a pattern strongly associated with insulin resistance — sometimes even more reliably than glucose-based tests. The triglyceride-to-HDL ratio is increasingly used as a simple proxy. A ratio above 3.0 in Indian patients should raise concern about underlying insulin resistance.
Blood pressure above 130/85 mmHg is included in the diagnostic criteria for metabolic syndrome and frequently clusters with insulin resistance. If your lipid profile shows the pattern above and your blood pressure is elevated, insulin resistance is a strong possibility — even if your sugar numbers still look normal.
When CGM Helps Detect What Routine Tests Miss
Continuous glucose monitoring (CGM) is a wearable sensor that tracks your glucose levels every few minutes for 10–14 days, generating a detailed map of how your blood sugar behaves throughout the day and night — not just during a single fasting moment.
CGM does not measure insulin directly, so it is not a standalone insulin resistance test. However, it excels at revealing patterns that routine tests miss: post-meal spikes after specific foods, overnight glucose elevations, the glucose impact of stress and poor sleep, and the difference between meals that appear similar on paper but produce very different glucose responses.
At Redial Clinic, we find CGM most useful for patients who have borderline labs but want to understand exactly how their body responds to their usual Indian meals — their morning paratha, their afternoon rice, their evening chai with biscuits. The granularity of CGM data often motivates dietary changes far more powerfully than a single number on a lab report.
CGM is not necessary for everyone. It is most valuable when fasting numbers are normal or borderline but there is clinical suspicion of post-meal dysregulation, or when a patient in a reversal programme wants real-time feedback on how meals and lifestyle changes are affecting their glucose patterns.
Which Tests to Discuss With Your Doctor
If you suspect insulin resistance, the most informative initial panel includes fasting glucose, fasting insulin, HbA1c, a lipid profile (with triglycerides and HDL), and a waist circumference measurement. From the insulin and glucose values, your doctor can calculate HOMA-IR. If post-meal issues are suspected, a 2-hour post-meal glucose test or a short CGM trial can add further clarity.
Not every patient needs every test. A practical approach:
- For general screening (family history of diabetes, weight gain, fatigue): Start with fasting glucose, fasting insulin, HbA1c, and a lipid profile.
- For borderline or confusing results (normal fasting sugar but symptoms persist): Add post-meal glucose and consider CGM.
- For tracking improvement (during a reversal programme): Repeat fasting insulin and HOMA-IR every 3–6 months alongside HbA1c.
- For women with PCOS: Insulin resistance testing is especially important, as it is a key driver of PCOS symptoms. Fasting insulin and HOMA-IR should be part of the initial workup.
If you have been told your sugar is ‘normal’ but you feel something is off — persistent fatigue, difficulty losing weight despite effort, darkened skin folds (acanthosis nigricans), or a growing waistline — asking your doctor for a fasting insulin test is a reasonable and evidence-based next step. It is one of the simplest additions to a standard blood panel, and it can reveal what glucose tests alone cannot.
Frequently Asked Questions
Is fasting insulin a routine test?
No, fasting insulin is not included in most standard health check-up panels in India. It must usually be requested separately. Most routine screenings include fasting glucose and sometimes HbA1c, but not insulin. If you have risk factors for insulin resistance — such as a family history of diabetes, central obesity, PCOS, or borderline glucose results — ask your doctor to include fasting insulin in your next blood test. The test is widely available at major diagnostic laboratories and typically costs between ₹300 and ₹800.
What is a good fasting insulin level?
A fasting insulin level below 12 µIU/mL is generally considered normal, and below 5 µIU/mL indicates excellent insulin sensitivity. Levels between 12 and 20 µIU/mL suggest early insulin resistance, while levels above 20 µIU/mL point to significant resistance that warrants further evaluation. It is important to note that optimal ranges are not universally standardised, and your doctor should interpret your result alongside other markers like glucose, HbA1c, and your clinical history.
Can HbA1c be normal in insulin resistance?
Yes, HbA1c can remain within the normal range for years while insulin resistance is already present. HbA1c reflects average blood glucose, not insulin levels. In the early stages of insulin resistance, the pancreas produces extra insulin to keep glucose controlled — so HbA1c stays normal even though the underlying metabolic machinery is already under strain. This is precisely why fasting insulin and HOMA-IR are more sensitive early indicators than HbA1c alone.
Do I need a CGM to detect insulin resistance?
No, CGM is not required to detect insulin resistance. Fasting insulin, HOMA-IR, and a standard lipid panel are the primary tools for identifying insulin resistance. CGM is most useful as a supplementary tool when you want to understand your post-meal glucose patterns in detail, especially if fasting tests are normal but symptoms or risk factors persist. It provides a fuller picture of glucose behaviour but does not measure insulin directly.
Get Your Insulin Resistance Markers Reviewed
If your fasting sugar has been ‘normal’ but you still experience fatigue, unexplained weight gain, or a growing waistline, a metabolic workup can reveal what standard tests miss. At Redial Clinic in Green Park, New Delhi, we assess fasting insulin, HOMA-IR, lipid patterns, and glucose behaviour together — so you get a clear picture of your metabolic health, not just a single number. Book a lab review and metabolic workup consultation.
Medical Disclaimer
This article is for informational purposes only and does not constitute medical advice. Always consult a qualified healthcare professional before making changes to your diet, exercise, medication, or treatment plan.
References
- Tabák AG et al., “Prediabetes: a high-risk state for diabetes development,” Lancet, 2012. https://doi.org/10.1016/S0140-6736(12)60283-9
- Matthews DR et al., “Homeostasis model assessment: insulin resistance and β-cell function from fasting plasma glucose and insulin concentrations in man,” Diabetologia, 1985. https://doi.org/10.1007/BF00280883
- Ascaso JF et al., “Insulin resistance (HOMA-IR) cut-off values and the metabolic syndrome in a general adult population: effect of gender and age,” BMC Endocrine Disorders, 2013. https://doi.org/10.1186/1472-6823-13-47
- American Diabetes Association, “Standards of Care in Diabetes — 2026,” Diabetes Care, 2026. https://doi.org/10.2337/dc26-SINT
- Mohan V et al., “Epidemiology of type 2 diabetes: Indian scenario (ICMR–INDIAB study),” Indian Journal of Medical Research, 2007–2011. https://doi.org/10.4103/0971-5916.87688
- International Diabetes Federation, “The IDF consensus worldwide definition of the metabolic syndrome,” 2006. https://www.idf.org/our-activities/advocacy-awareness/resources-and-tools/60:idfconsensus-worldwide-definitionof-the-metabolic-syndrome.html
- ICMR, “Guidelines for Management of Type 2 Diabetes, 2018.” https://main.icmr.nic.in/sites/default/files/guidelines/ICMR_GuidelinesType2diabetes2018_0.pdf